I would argue that the most important step in calibrating printing equipment is determining individual ink channel limits. This will help define the maximum gamut achievable by your equipment. Ink limiting will also improve your color quality by ensuring that you don’t have TOO MUCH or TOO LITTLE ink. Believe it or not, this is a very common occurrence. More ink does not necessarily mean more color or more gamut. For example, too much ink can make your BLACKs look BROWN. Or CYAN look BLUE. The amount of ink used can greatly affect the hue and appearance of any color.
So now that we know how important ink limiting is, we should take time and care during this step in the calibration process. The more time you spend here, the better your end result will be.
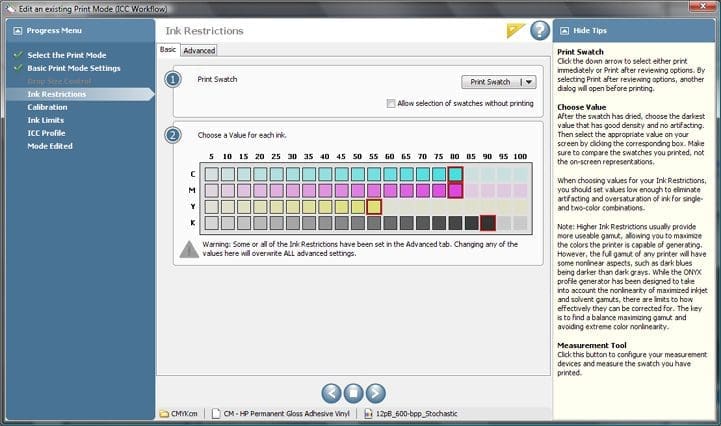
HOW TO DETERMINE WHEN TO LIMIT INK – There are some print conditions that might not require ink limiting. For example: When using an Epson Printer with high-end proofing paper, you likely will not need to limit individual ink channels within your RIP software. Inkjet devices like this have a maximum achievable ink limit of 400. They are known as Inkjet 400 devices. Most proofing papers can handle the maximum amount of ink allowed by the printer driver which does have “some” ink limiting built in. And when calibrating a printing press, you will measure ink film thickness (density). Things that indicate over inking would be mottling, pooling, or wetness. Where the density or saturation peaks is where you should set the ink limit. When does the ink stop getting darker or changing color? That’s where you limit the ink! Here is a graphic of a common ink limiting chart below:
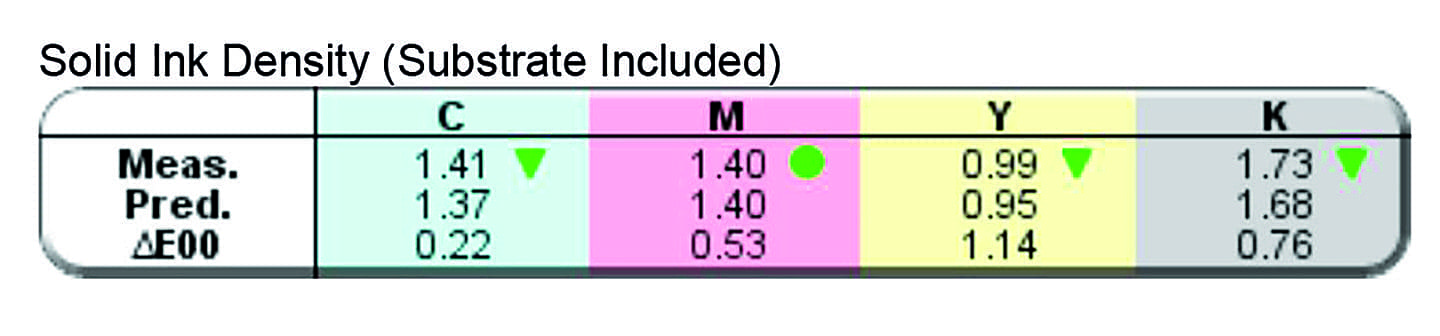
HELPFUL SOFTWARE – When determining ink limits on press, it’s really helpful to have software that can help you determine which direction to go with your ink limits. More ink or less ink? I like to use a program called SpotOn! Press. The graphic below is a slice of the “Analyze” portion of the SpotOn software that determines ink density limits. Notice the arrows pointing up or down. The top line is the measured density. The middle line is optimal and recommends density, etc.